Quick links:
- AI & Data Projects – GitHub
- Visualization Projects – Tableau Public
Data Science/Engineering Projects
GenAI RAG Pipeline for Audit Automation
Developing a advanced multi-LLM RAG pipeline to parse, evaluate and evaluate compliance and QA of an audit. This is an extension of Audit report generation project that can produce audit report by analyzing underlying documents.
Developed in Python
NFL Tackle Analytics
Conducing a play by play analysis using tracking data at 24 samples/second for entire 2022 NFL season, to determine probability of tackle and interception.
Developed in Python
Reception of Mask Enforcement
Developing a Python package that can mine tweets from multiple social media accounts and provide sentiment analysis of tweets and reddit comments.
Developed in Python. GitHub
Rubrics Builder Web App in Python
Developed a web app using Python to replace existing Excel Solution to quickly build Rubrics for Professors to grade their students. The app is deployed here for quick on the go access.
Developed in Python. GitHub
Data Pipeline Learning Project
Developing a data pipeline prototype that taps into SEPTA’s Financial Database and outputs Tableau ready files for our Dashboards.
Developed in Python. GitHub
Text File Miner
Developed a file miner for SEPTA. The script can extract information from unstructured, hard to clean text files. It detects the file type from 25 possible types, and can automatically clean, process and output a tabular file, saving hours of manual work per file.
Developed in Python. GitHub
AI Blackjack player
Developed a blackjack player in Python that learns from 10,000s of games and improves overtime. It uses Q* learning algorithm (reinforcement learning)
Developed in Python. GitHub
Personal Investment Advisor
Developed an investment advisor which uses a neural network to predict stocks for upcoming month and suggests the top 5 stocks to invest in,
Developed in JAVA. GitHub
Slotify – A music streaming website
Developed a streaming website similar to Spotify as a hobby project to learn Web development. Supports playlists, and user accounts.
Developed using HTML, CSS and JavaScript. GitHub
Data Challenges, Insights and Analytics Projects
Temple Analytics Challenge 2019
How can we improve clinical trial success rates? Finished as a finalist from over 250 submissions, check out the dashboard here
Check out the analysis: GitHub
Analysis in Python, visualization in Python, Tableau and Adobe Illustrator.
Faire Data Challenge
Investigated the decline in new customer acquisition. Check out my report here
Analysis and Visualization in Python. GitHub
Visualization Projects
Overtime Tracking Dashboard
Developed a dashboard that let’s a user track employee overtime using dynamic filters, parameters and more.
Visualized in Tableau

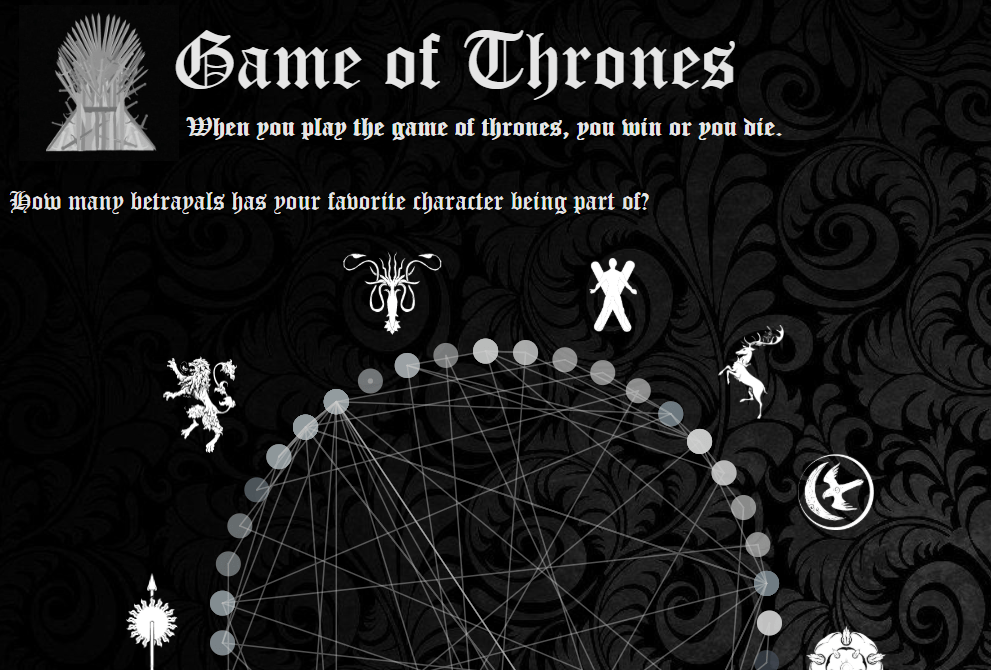
Game of Thrones: Betrayals Visualized
We look at the betrayals from Game of thrones (up to Season 5). Tableau Public
Visualized in Tableau
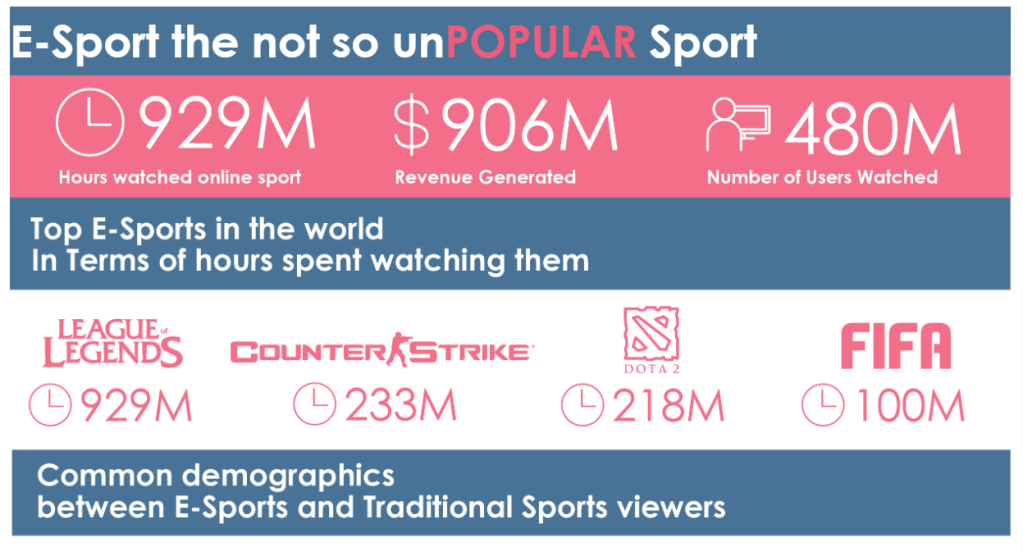
Temple Analytics Challenge 2018
Rise of E-sports and how do e-sports rank up to traditional sports? Check it out on my Tableau Public
Visualized in Tableau